In today’s digital marketing age, sometimes us marketers feel like we’re drowning in metrics: impressions, cost per click, click-through rates, engagement rates, email open rates…the list goes on and on! But which of these metrics actually matter to your business? Which of these numbers are most important to help you figure out what is actually working and what needs to be re-tooled?
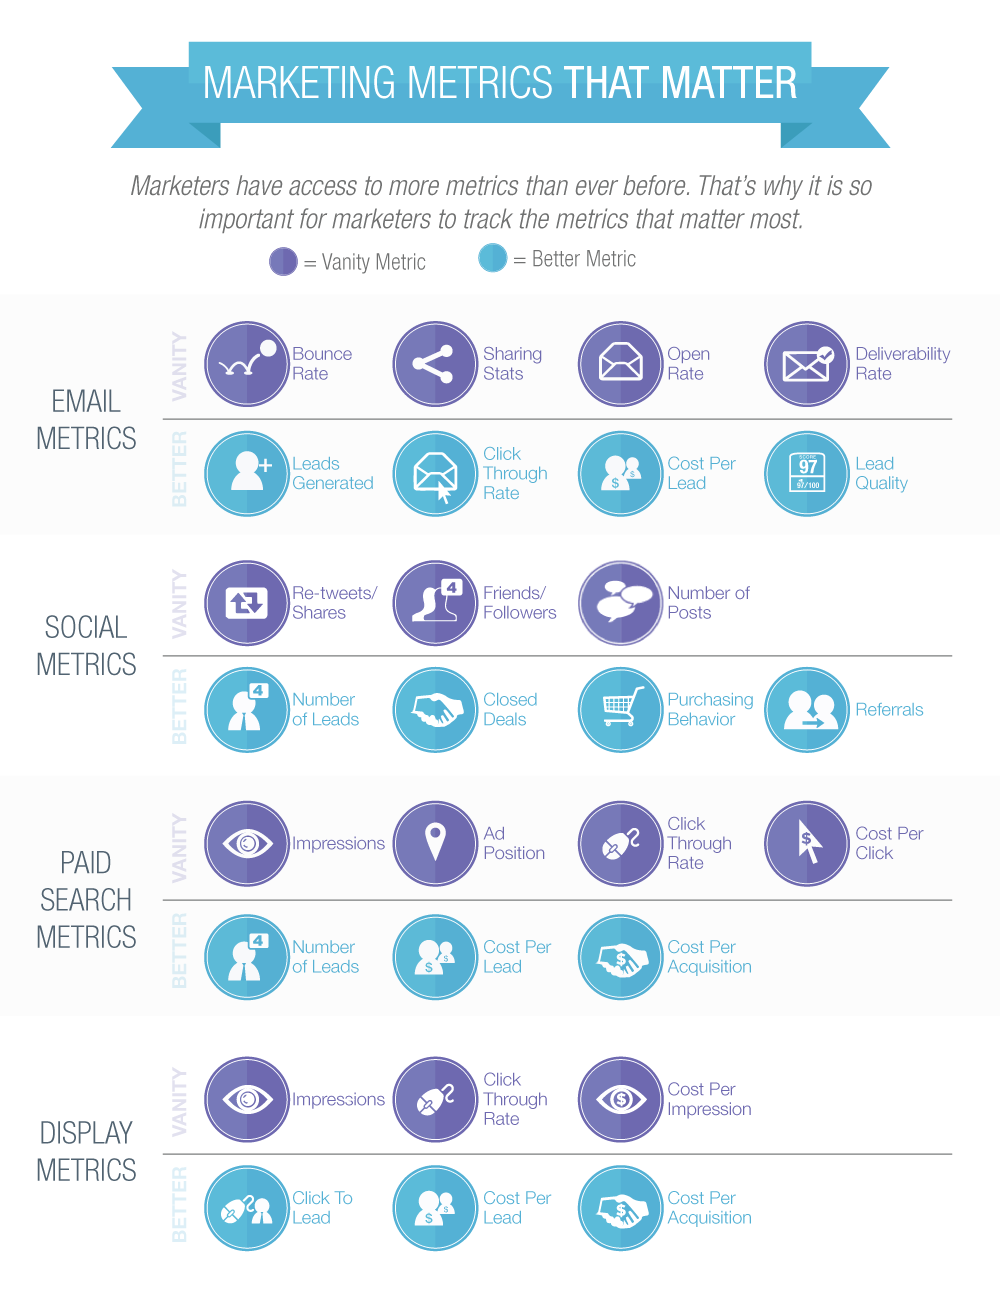
There are many opinions out there about which metrics matter, but I came across this infographic that I think does a nice job of comparing well-known metrics across the digital landscape and prioritizing which ones actually help marketers tell an informative story about our effectiveness, for ourselves and whomever might be at the receiving end of our reports.
Vanity vs Better
Actually, I’d say a better definition of the distinction made in this infographic “Vanity vs Better” is vanity vs results.
So it’s not totally fair to dismiss them for their vanity, some of these stats just need time to begin to have an effect on results-oriented metrics.
For example, with social stats, the number of posts and regularity of posts increases trust and authority, which leads to growing an audience, which in turn increases the number of Re-Tweets/Shares, which additionally leads to numbers of Friends/Followers growing over time. If people say “gosh my Facebook page has 100 followers but I don’t have sales yet” they might give up too soon before allowing the time required for social marketing to work.
The value of this cheat sheet is to remind us of why we’re tracking the vanity metrics in these areas, our efforts should always tie to overall strategy and marketing goals. But also remember “vanity metrics” need not be completely discounted — they can correlate to bottom lines, if given time. It’s our job as marketers to go after increasing the “vanity” metrics in a way that gives us the best shot at increasing the “better” metrics: the real nitty-gritty, bottom-line metrics like increased leads, sales, and profits.


